In 2015, for the first time in my 30-year scientific career, I had a paper rejected by four journals without even being sent to review. Of course, I am used to journals reviewing then deciding it is not for them – that does happen, but not to even send to experts?! I was very surprised by this, particularly since I had been speaking about the work described in the paper for almost two years at UK and international meetings and the talks had always drawn a large and interested audience. The paper being thrown out by editors without consulting experts in the field was the second in our series about a 48-replicate RNA-seq experiment which I have described earlier in this blog and was the result of a collaboration with fantastic experimentalists (Mark Blaxter at Edinburgh, and Tom Owen-Hughes and Gordon Simpson at Dundee). Thankfully, the fifth journal, RNA, sent it to review, and it was published on 16th May 2016. (Schurch, et al, 2016, RNA).
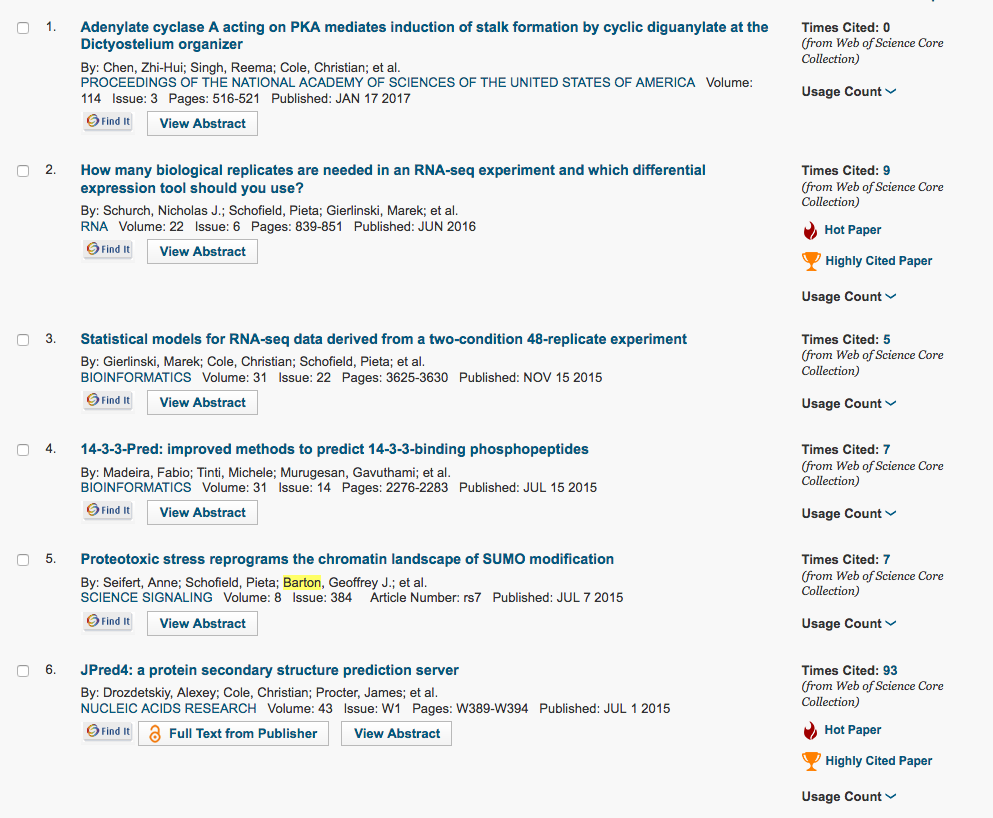
It was great to get the paper published in a good journal and especially nice to see that it stayed at No. 1 or No. 2 in the top accessed papers on the RNA website for six months (Figure 1 shows a snapshot – I did check this every week!).
This week (1st March 2017), I was doing some citation analysis and noticed to my surprise and pleasure that the RNA paper was rated by ISI Web of Science as “Hot” (Figure 2, while Google Scholar says it has 28 citations – I like Google Scholar!! ).
This means it is in the top 0.1% cited papers in the field of biochemistry or molecular biology for the last two years! In fact, there are currently only 28 “Hot” papers in this field from the whole UK. The work also generated the most interest on social media of any of the papers I have had a significant role in, with a current Altmetric score of 177 (Figure 3).
So, by any measure, this is a paper that was timely and continues to have impact!
The question then is: “Why did four journals consider it too boring to review?”.
I am not sure why eLife, Genome Biology, Genome Research and NAR would not review it, but will speculate a bit. I won’t quote the editor’s form rejections, but they all had a similar flavour that we have seen on other occasions: “Not of general interest.”, “Too technical.” “Appropriate for a more specialised journal…” To be fair to eLife, the original title and abstract for the paper were perhaps less “biologist friendly” than they could have been, but we fixed that before Genome Biology, Genome Research and NAR. To be fair to NAR, the editor was interested but did not think the paper fitted any of their categories of paper.
None of the editors said this explicitly but I did wonder if: “Not of general interest” was code for “not in human…”. Perhaps they thought our findings might not be relevant to a Eukaryote with a complex transcriptome? We also worried a bit about this, but our recent paper in Arabidopsis (Froussios et al, 2017; OK, not human, but certainly a Eukaryote with a complex transcriptome!) shows essentially the same result, albeit on fewer replicates. Another factor may have been due to us publishing the manuscript on the arXiv preprint server at the point of submission in 2015. Although all the journals say that they are happy with preprint submission, I wonder how happy some editors are with this? Of course, it may just be that they say this to everyone and so only respond to the authors who complain the loudest? I hope that is not the case.
Although it was annoying and time consuming at the time to have the paper rejected four times without review, I’m obviously very happy that the big, cross-institutional team that did this work was right about its importance! Lots of people from diverse fields have made positive comments to members of the team about how useful the paper is in their experimental design decisions. It is certainly good to feel that some of your work is appreciated!
I do wonder though if always aiming to publish in “good” journals is the right thing to do? Surely, it is more important that our work is visible and can be used by other scientists as early as possible? I will explore this some more in Part 2 of this blog, later…
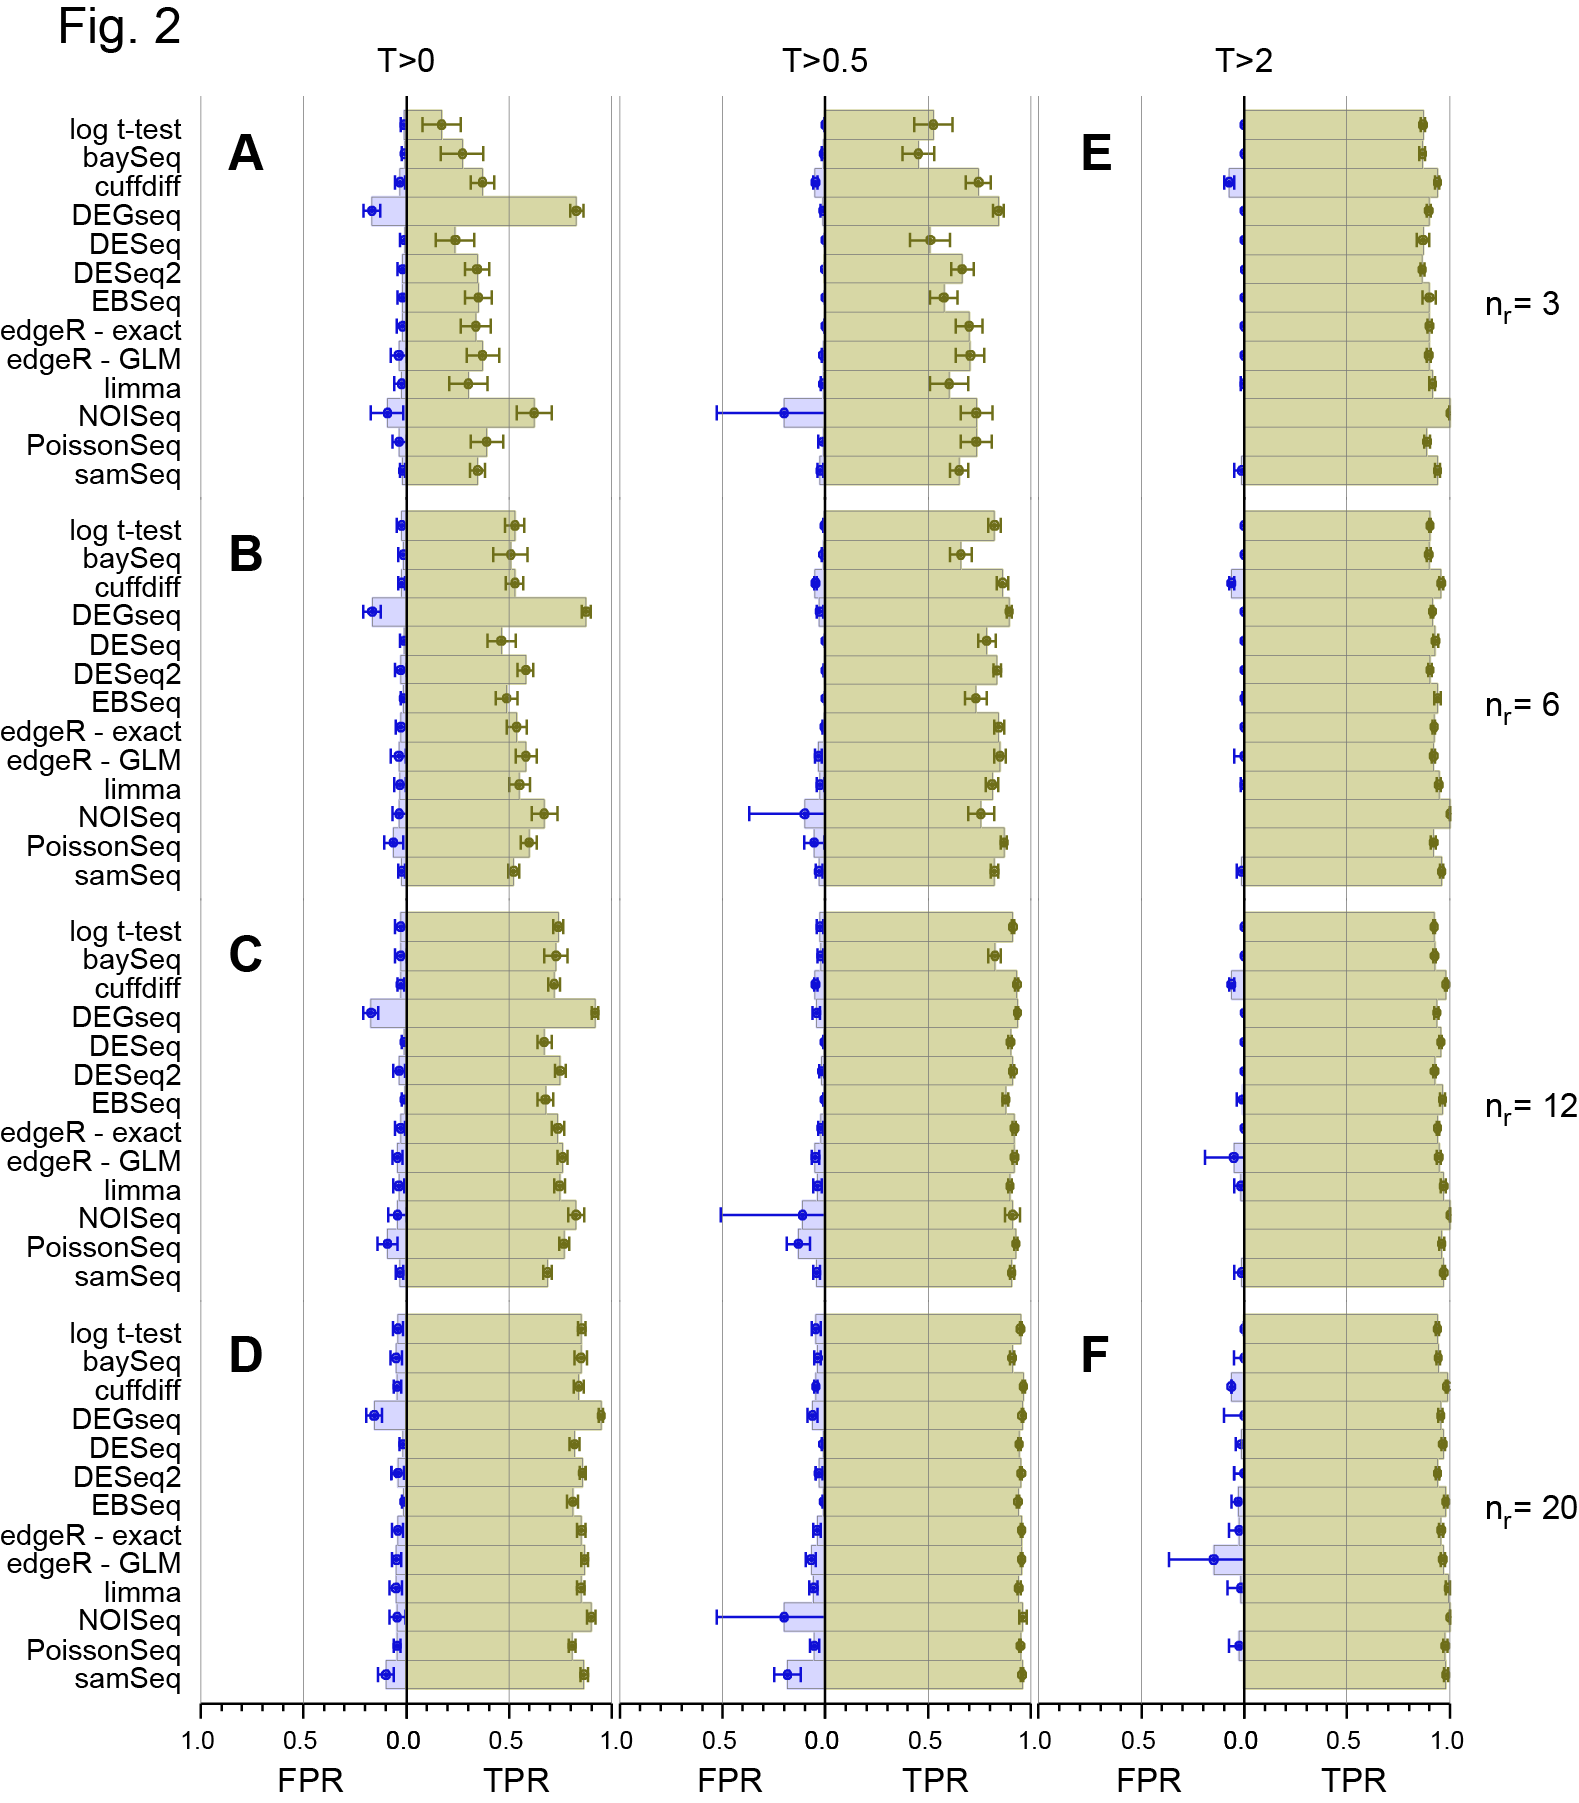
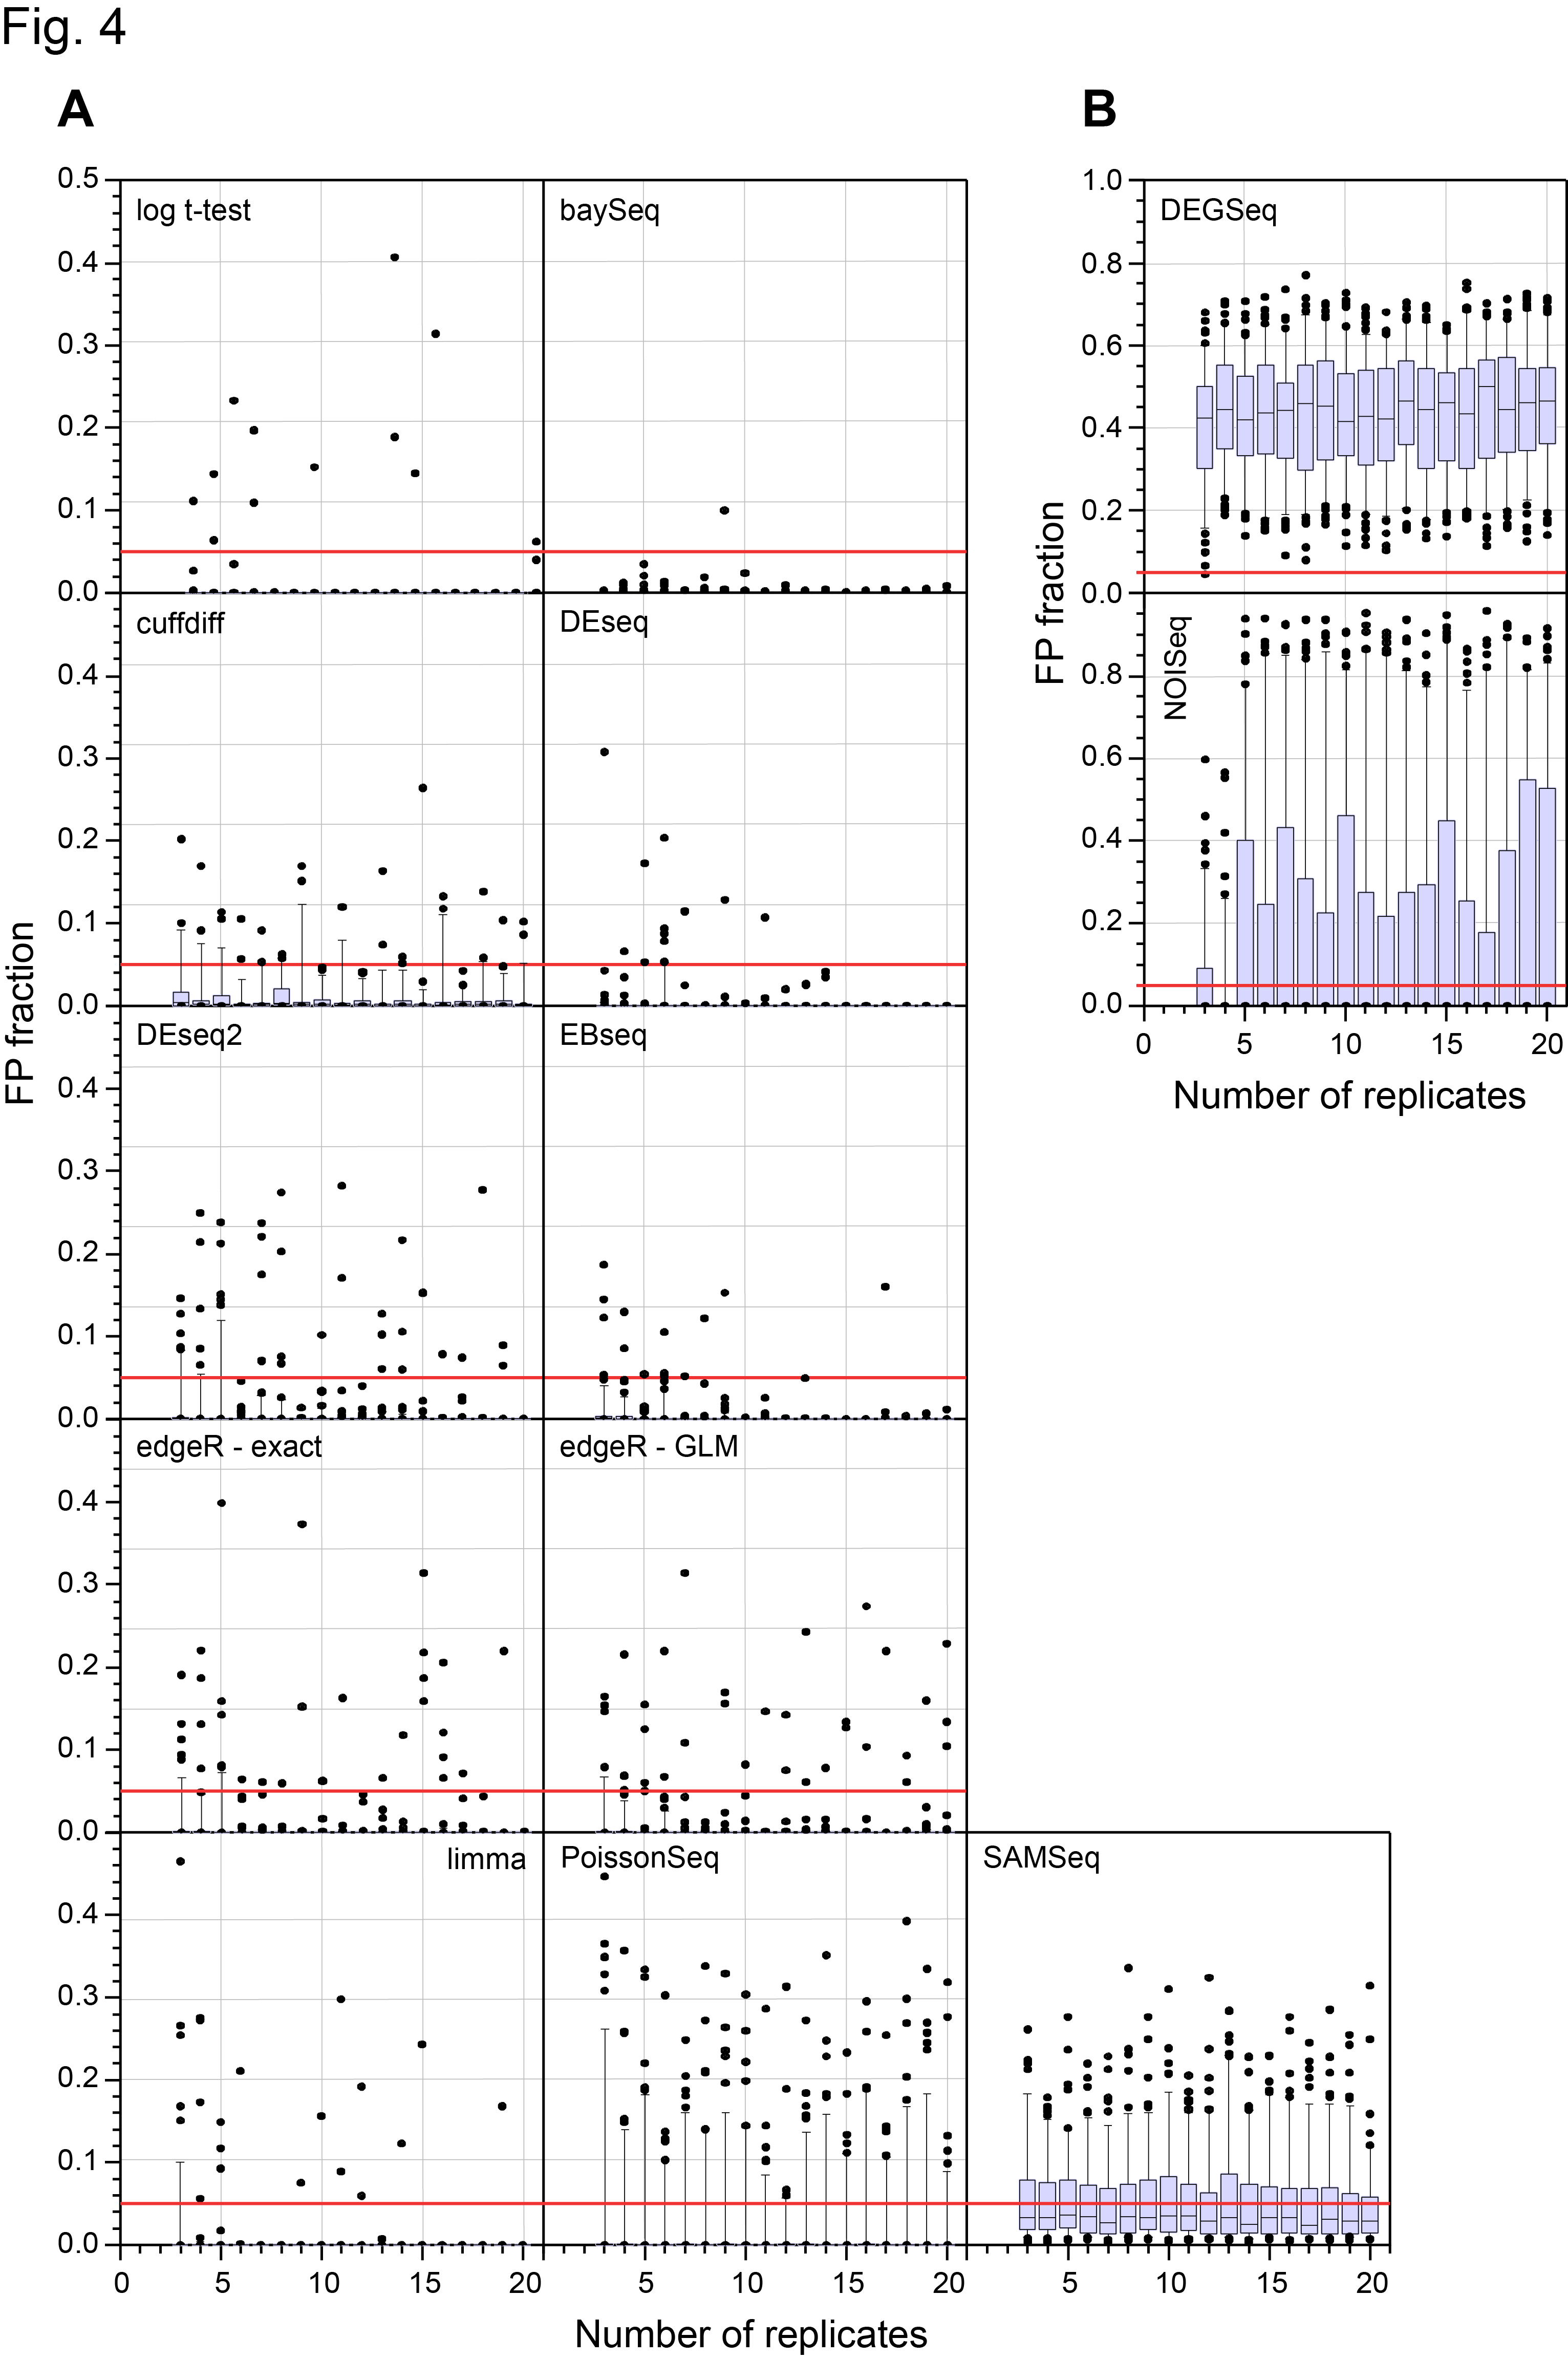
On 28th March, the main paper in our study of a 48 replicate RNA-seq experiment designed to evaluate RNA-seq Differential Gene Expression (DGE) methods was published on line by the journal RNA (Schurch et al, 2016, RNA). I’ve discussed this experiment in more detail in previous posts (48 Replicate RNA-seq experiment and 48 Rep RNA-Seq experiment: Part II ) so please see them for background information. Those who have been following the story on twitter since then will know that we made a mistake in a couple of the figure panels in that paper and this affected the conclusions about the False Discovery Rate (FDR) of one of the 11 methods we examined (DESeq2). Thanks to great help from Mike Love (the developer of DESeq2) and the fact we had made all the code and data available, we together identified the problem and have now corrected both the figures and the text in the manuscript to reflect the correct results. We caught this error early enough so that the online (and print !) versions of the manuscript will be corrected. Unfortunately, the revised version won’t be on-line until 16th May so I’m putting the two most important revised figures here to avoid confusion about the performance of DESeq2 which we now find is at least as good as DESeq and the other methods that performed well in our test.
In case you were wondering, the mistake was caused by a combination of “features” in two packages we used, SQLite and perl PDL. DESeq2 by default pre-filters the data before calling differential expression. As a result it outputs floating point numbers and “NA”s. NA has a special meaning in the language R. We stored the output in an SQLite database which happily puts NAs and numbers in the same field. We then read the SQLite database with a perl program and the PDL library in order to make the plots. This silently converted NAs to zeros which is not what you want to happen! The effect was to call some genes as highly significant when in fact they were not called this way by DESeq2. This bug also influenced the results for DEGseq but did not affect our overall conclusions about that method. The bug has been fixed in the version of the code now on GitHub (https://github.com/bartongroup).
Although the team and I are embarrassed that we made a mistake when we had tried very hard to do this big study as carefully as possible, we’ve found the last few weeks a very positive experience! Mistakes often happen in complex research but they can go unnoticed for a long time. Here, the turn-round time was a few days on social media and a little over a month in the conventional literature. I think this illustrates how early and open access to manuscripts, code and data can help identify problems quickly and lead to better (or at least more reliable) science!
I’ll write in a separate post about the publication process and add my views on how I think it could be improved, but for now I just want to thank everyone involved in fixing this problem. Firstly, Mike Love who has been very professional throughout. He emailed as soon as he spotted the anomaly and then worked with us over a few days to identify whether it was real or an error. Thanks Mike! Secondly, the staff at the journal RNA, in particular the production editor Marie Cotter who responded very quickly and helpfully when we told her we needed to change something in the manuscript. Finally, the entire team in Dundee who worked on this project to find the bug and revise the m/s in good time. Special thanks to Nick Schurch who somehow managed to juggle his small children and other family commitments to make it all happen quickly!
Over the last few years I have had the privilege of being a member of my department’s Athena SWAN committee. Before going on the committee I thought I was aware of gender equality issues in the workplace but the discussions we have around the committee table have opened my eyes to the problems and what we can all do as individuals to make a difference.
The consequence of having my eyes opened leads me to notice situations and behaviour outside work that I probably would not have done before.
So, what am I leading up to? I don’t usually watch talent shows, but I am a big fan of the singing talent show “The Voice” which is shown at the moment on Saturday evening on BBC1. Why? Well, in general the contestants are all phenomenally good at what they do. Also, I like the format of the show where the four high profile “coaches” listen to performances in special rotating chairs with their backs to the singer and only turn their chairs around if they like what they hear. If more than one coach turns, then the contestant can choose which coach’s team they would prefer to join. So, the principle is that the contestants, at least in the first round, are only chosen on what they sound like, not their appearance.
Last week was the second round of the show where pairs of contestants “battle” by singing duets and after the song, only one in each pair is selected to stay. By this stage in the competition “stage presence” starts to make a difference since the coaches can see the contestants. During the show last week, I was struck by differences in the way the male and female coaches and the show hosts spoke about the various contestant pairs. In particular, one pair was two young men who did a fantastic performance of their song. In the first round the female coach had been very vocal about how attractive she found them both. When the female host came on stage after the performance, she remarked on how “nice (hot)” it was to be on the stage at the moment (with these two attractive men), and later asked the coaches “…can you feel the level of testosterone…”. After the female coach had commented on the winner’s looks again, the host commented “…just so you all know, even his hair smells nice…”.
I wondered how long the male host on the show would have kept his job if he had made similar comments about female contestants? Or indeed, how long a male coach would last on the show if he made such strong innuendo-led comments as the female coach did. It seemed to me that there was quite a gender bias in what was acceptable behaviour on prime-time UK TV.
A possibly extreme way to look at it is The Voice is a kind of job interview. Here were two guys in a stressful interview being sniffed by one of the company staff who made a point of showing she was aroused by them, while the interviewer made comments about their sexual attractiveness. I wonder how comfortable the two guys were about all this – they seemed OK, but what else could they do in a competition situation? The assumption is that men will always like and be flattered by the attention of women, but this is clearly just as wrong an assumption as if the genders were reversed.
I might not have bothered to write this blog if it had not been for something else that happened this week. I visited an office about a work thing and while I was in the all-female office, I noticed a postcard sized photo of a naked man by one of the desks. It was a very tasteful picture of a classically beautiful body from behind of a man with a sandy bottom. It was a nice photo, but when I saw it I said something about it because I was surprised to see it at all in the workplace. The folk in the office were a bit embarrassed by the photo, but it turned out to “…belong to someone else who used to be here…” and “…we should really take that down…”. This reminded me of my reaction to the Voice the previous week so I mentioned this to them. We all agreed that currently what was acceptable for a female to say or do to a male in public was quite different to what was acceptable the other way around. One comment from the females was: “…well, when a woman does it, it is just a bit of fun…” I wonder where I have heard that before?!
So this brings me back to Athena SWAN and workplace equality. The Athena SWAN application process is all about showing how, as an organisation you have recognised gender issues and put procedures in place as a result that help equality. So for example, last year we shifted the time of all our major seminars to earlier in the day (from 16:00) so they and the after-seminar receptions could be attended by people with carer responsibilities. For individuals, one message is that you should think about what you say or do to judge whether it might make someone else uncomfortable. This is probably good advice for life generally, but especially in the workplace. While some things like the blatant innuendos on the Voice last week might be obvious to avoid, others may be subtle. Some phrase, expression or behaviour you have had since childhood could be perfectly acceptable to one person but deeply offensive to another. Likewise, relaxed conversation and humour amongst friends after work might be completely inappropriate around a committee table or other workplace situation. It is up to us, if we are offended by something, to say so straight away. Often, when pointed out, the perpetrator will be horrified to discover what they thought was quite innocent behaviour was not seen that way. Other times of course, people will be baffled as to why you are upset. Whether people are baffled or understanding of a behaviour depends on what is acceptable in wider society and thankfully that is changing continuously for the better.
A few months ago I spent an enjoyable hour or so listening to one of my fellow Professors in Life Sciences giving a seminar in our Athena SWAN programme. It set me thinking about broader issues of inequality in research, so I thought I would write something about this before I forgot! I’ll get to the computational biology bit at the end…
Athena SWAN for those who don’t know is run by the UK Government and originally had a charter that says:
Recognising commitment to advancing women’s careers in science, technology, engineering, maths and medicine (STEMM) employment in higher education and research.
In 2015, it was merged with other equality schemes across the Arts and Social Sciences. You can read more about Athena SWAN on the Equality Challenge Unit’s website (www.ecu.ac.uk), but the principle is that Universities and University Departments can apply for Bronze, Silver or Gold status in Athena SWAN. The process of meeting the demands of these different levels requires a lot of inward looking by institutions about how inequality is handled in the institution and what is being done to help address it. This in my view is a very good thing – being on the Athena SWAN committee for our department has certainly helped raise my own awareness of the issues.
Leaky pipeline and the Petrie Multiplier
As our speaker reminded us in her talk, the big problem in STEMM subjects across UK higher education is that there is a “leaky pipeline” where the proportion of women at each level of seniority drops. The department I work in is fairly typical of life sciences departments in that there are more female undergraduate students than male (about 60% female) this drops to 55% at Ph.D. student level, then down to 45% at postdoc. However, by the time you get to Principal Investigator (Independent Research Fellow, Lecturer, Senior Lecturer, Reader, Professor) women are down to about 20%. Clearly, this kind of gender inequality is true across the whole of our society in many professions and there are multiple reasons for it that I won’t discuss here.
The talk was very entertaining. It took us from her early life through various high and low points in life and career. I wasn’t surprised to learn that she had been the victim of sexism at times, what horrified me more was that even today, she experienced this in various ways from peers in science. She had discovered the best way to deal with it if you did not have a good “come back comment at the time” was not to agonise or get angry, but just to accept that some people are just jerks (my word not hers) and move on. I don’t know if this is the best strategy or not, but our speaker then introduced us to the “Petrie Multiplier” which is described in detail in Ian Gent’s excellent blog post and how this had made her realise that a large part of what she experienced was dominated by the effect of being in a minority rather than any particular personal targeting.
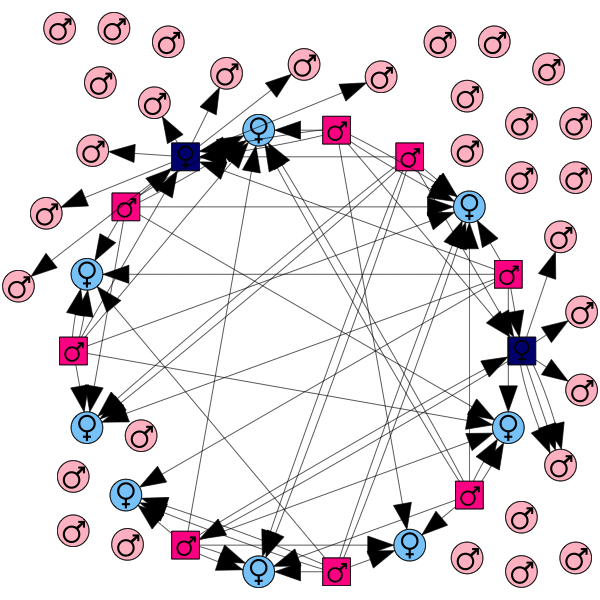
Although focused on gender inequality, the principle of the multiplier is general. It says if you have a crowd of people made up of two groups where one group is in the majority, say 5 to 1, and a fixed percentage of each group (say 10%) discriminate against members of the other group, then if you are in the smaller group, the likelihood that you will be the victim of discrimination is proportional to the square of the ratio between the groups. Thus, in the case of a 5 to 1 ratio like this, if you are in the smaller group, you are 25 times more likely to be discriminated against than someone in the majority group.
I chose 5:1 as the ratio since that is the ratio of male to female PIs at my institution, but clearly, minority groups exist everywhere. Although it is a very simple model, the Petrie Multiplier helps to explain (but not justify) why it is exceptionally hard for any minority to get their voice heard. Even a small amount of bias from members of the majority leads to a big perceived effect on the minority.
Computational Biology…
Minorities occur in science all the time! Scientists all know how hard it can be to get new ideas or ways of working accepted against accepted dogma. This was (and possibly still is) true of the field of computational biology/bioinformatics. In the 1980s and 90s, people who thought of new ways to analyse data, spent their time analysing existing datasets rather than generating new ones or who developed novel computational methods, were in a tiny minority of biologists. There was scepticism and lack of understanding from the majority of biologists whose careers had grown up without the need for deep knowledge of computing. As a consequence, getting funding to do computational research in biology was difficult.
So, are things better now for Computational Biology? There is certainly broad understanding of the need for computational skills in interpreting data. However, the majority of biological scientists are still experimentalists whose research focuses on specific biological questions. As a consequence, funding programmes are nearly always linked to the creation of new data sets rather than reflection on how to make new use of data that is already there or to enhance methodology.
This bias can make it difficult for scientists trying to start their independent career who are driven by methods development rather than the desire to probe a specific biological question. However, I am optimistic that as the ratio of scientists with expertise and understanding of computing increases in our community, it will become easier for the next generation of innovative method developers to forge their careers in this exciting era for our science.
The main questions we were aiming to answer in this work when we started it over 2 years ago were, for RNA-seq experiments that study differential gene expression (DGE):
How many replicates should we do?
Which of the growing number of statistical analysis methods should we use?
Are the assumptions made by any of the methods in (2) correct?
How useful are spike-ins to normalise for concerted shifts in expression?
Paper I (Gierlinski et al, 2015), addressed Point 3 in the list. Our second paper looks in detail at points 1 and 2. The high number of replicates in our experiment allowed us to see how variable results would be if we had fewer replicates. For example, we took 100 sets of 3 replicates at a time to see the variance (uncertainty) in an experiment with only 3 replicates. We did the same thing for 4 replicates and so on up to 40 replicates. In effect, the sampling over all the different DGE methods we did was like performing over 40,000 RNA-seq experiments!
The Abstract of the paper, Figures and Tables give a summary of the conclusions, so I won’t repeat them here, but since it is quite unusual to do 48 replicates (Well to our knowledge no one has done this before!) I thought I would briefly summarise why we did it and the kind of lessons we learned from the experiment and its analysis.
Background
My group’s core interests were originally in studying the relationship between protein sequence, structure and function. We still develop and apply techniques and tools in this area such as Jalview, JPred and other more specialised predictive tools (see: www.compbio.dundee.ac.uk). In around 2007 though, we did our first analysis of NGS sequencing data (Cole et al, 2009) in collaboration with wet-lab colleagues here in Dundee. This led us into lots of collaborations on the design and analysis of NGS experiments, in particular experiments to determine changes in gene expression given various experimental and biological stimuli. Since we are in a big molecular/cell biology research centre, our experience spans a wide range of species, biological questions and experiment types.
To begin with we looked at differential gene expression (DGE) by Direct RNA Sequencing (Helicos biotechnology, now seqLL) which eventually led to some publications (e.g. Sherstnev et al, 2012; Duc et al, 2013; Cole et al, 2014; Schurch et al, 2014) using that technique, but later we turned to what has become the “standard” for DGE: Illumina RNA-seq. Irrespective of the technology, we kept facing the same questions:
How many replicates should we do?
Which of the growing number of statistical analysis methods should we use?
Are the assumptions made by any of the methods in (2) correct?
How do you deal with concerted shifts in expression (i.e. when a large proportion of genes are affected – most DGE methods normalise these away…)
We wanted clear answers to these questions, because without good experimental design, the interpretation of the results becomes difficult or impossible. Our thinking was (and still is) that if we get good data from a sufficiently powered experiment, then the interpretation would be much easier than if we were scrabbling around trying to figure out if a change in gene expression is real or an artefact. Of course, we also wanted to know which of the plethora of DGE analysis methods should we use? When we tried running more than one, we often got different answers!
The Joy of Benchmarking ?
2-3 years ago when we were worrying about these questions, there was no clear guidance in the literature or from talking to others with experience of DGE, so when Nick Schurch and others in the group came to me with the idea of designing an experiment specifically to evaluate DGE methods, it seemed timely and a good idea! Indeed, most of the group said: “How hard can it be??”
My group has done a lot of benchmarking over the years (mainly in the area of sequence alignment and protein structure prediction) so I know it is always difficult to do benchmarking. Indeed, I hate benchmarking, important though it is, because no benchmark is perfect and you are often making some kind of judgement about the work of others. As a result you want to be as sure as you can possibly be that you have not messed up. As a developer of methods myself, I don’t want to be the one who says Method X is better than Method Y unless I am confident that that we are doing the test as well as we can. As a consequence, I think the care you have to take in benchmarking is even greater than the normal care you take in any experiment and so benchmarking always takes much longer to do than anyone can predict! Having said all that, I think in this study we have done as good a job as is reasonably possible – hopefully you will agree!
Collaboration
We don’t have a wet-lab ourselves, but we have a lot of collaborators who do, so the work was a very close collaboration between ourselves and three other groups. The experimental design was the result of discussions between the four groups, but Tom Owen-Hughes’ group selected the mutant, grew the yeast and isolated the RNA while Mark Blaxter’s group at Edinburgh Genomics, did the sequencing and “my” group did the data analysis. With the possible exception of growing the yeast and extracting the RNA, no aspect of this study was straightforward!
We settled on 48 reps since after doing some simulations, we thought this would be enough to model the effect of replicates without being prohibitively expensive. Mmmm, it was still quite an expensive experiment…
Why not other species?
Originally, we planned to do this experiment in multiple species, but while we had collaborators in Arabidopsis, C.elegans and mouse, it was Tom’s yeast team that were first with RNA (within a week of agreeing to do it!) so since the other groups were still planning, we decided to do an initial analysis in yeast and see what that told us. That initial analysis started in March 2013 and we presented our preliminary findings at the UK Genome Sciences meeting in Nottingham in October that year. It has taken us over a year to get the papers written since everyone in the collaboration is working on other projects as their “main” activity!
What is next?
Early on, we decided to include RNA spike-ins in the experiment. These are known concentrations of RNAs that are added to the experiment to provide a calibration marker. This was a good idea, but it made the lab work and sequencing more complex to optimise. It also confused us a lot in the early stages of the analysis, so we had to do another, smaller-scale RNA-seq experiment to work out what was going on. This will be covered in detail in Paper III since we learned a lot that I hope will be of use/interest to others in the field.
If, after reading the paper you have comments or questions, then we’ll all be happy to hear from you!
I and other members of the team have talked about this work at meetings over the last 18 months, but today the first of three (hopefully four) papers about a 48 biological-replicate RNA-seq experiment from my group (www.compbio.dundee.ac.uk), the Data Analysis Group (www.compbio.dundee.ac.uk/dag.html), and collaborators Tom Owen-Hughes, Gordon Simpson (http://bit.ly/1JobrGZ) and Mark Blaxter (http://bit.ly/1GXtC8M) was submitted to a journal and posted on arXiv (http://arxiv.org/abs/1505.00588). The data generated for this experiment has also been submitted to ENA and should be released in the next few hours.
Clearly, referees will have things to say about our manuscript, but I thought it was worth writing a brief summary here of the justification for doing this work and to provide somewhere for open discussion.
Briefly:
Paper I: The paper submitted today, deals with the statistical models used in Differential Gene Expression (DGE) software such as edgeR and DESeq as well as the effect of “bad” replicates on these models.
Paper II: Will be on arXiv in the next day or so, and benchmarks the most popular DGE methods with respect to replicate number. This paper leads to a set of recommendations for experimental design.
Paper III: Is in preparation, but examines the benefits of ERCC RNA spike-ins to determine concerted shifts in expression in RNA-seq experiments as well as estimating the precision of RNA-seq experiments. There will be an R-package accompanying this paper.
The main questions we were aiming to answer in this work when we started it 2 years ago were:
How many replicates should we do?
Which of the growing number of statistical analysis methods should we use?
Are the assumptions made by any of the methods in (2) correct?
How useful are spike-ins to normalise for concerted shifts in expression?
The aim with the experimental design was to control for as many variables as possible (batch and lane effects and so on) to ensure that we were really looking at differences between DGE methods and not being confused by variation introduced elsewhere in the experiment. This careful design was the result of close collaboration between us, (a dry-lab computational biology group), Tom Owen-Hughes’ yeast lab at Dundee, and Mark Blaxter’s sequencing centre at Edinburgh.
This experiment is probably the highest replicate RNA-seq experiment to date and one of the deepest. I hope that the careful design means that in addition to our own analysis, the data will be useful to others who are interested in RNA-seq DGE methods development as well as the wider yeast community.
I put this blog together after having a twitter exchange with Mick Watson and reading his excellent piece about how not to sack your professors.
Scientists are assessed primarily by the quality of their research output. A secondary assessment, but one which is tightly linked to publication quality is the ability to generate research income. I will come to that later…
Research output is primarily regarded as articles in peer reviewed publications, usually in scientific journals, though there are other methods of publishing. In order to be published in a journal, an article must pass “peer-review” by multiple scientists who are expert in the same field as the submitted work. The whole process of getting from a first manuscript to a final published article can be lengthy, involve multiple revisions and often require the author to go and do more research to satisfy requests from the peer-reviewers (often called “referees”). I’ve explained this whole process elsewhere, but will repeat it in a later post here.
However, what constitutes “quality”? In general this means being published in high-impact journals. A high-impact journal is one that is read by a lot of people and so includes a lot of articles that are cited by other articles. One measure of journal quality is to look at its impact factor. This is a number that reflects the number of citations that the journal receives. The simple view is that scientists that publish in journals that have high-impact are doing research that is widely respected. If you only publish in obscure, little read journals then your work is less regarded and so you are not such a good scientist. Unfortunately, this is a very simplistic view since some subject areas are not as trendy as others and so are less likely to appeal to high impact journals like Nature and Science. A further simplistic way to assess scientists is to count their total citations – how often do people cite their papers? If you work in a popular field, your citations are likely to be higher than if you work in a subject area that is less popular. This doesn’t make your work any the less important, or your quality as a scientist smaller, but a pure numerical measure of quality based on citations might be unfair unless carefully normalised against citations within your field. These factors make assessing quality in a scientists output very difficult and how to do it best is a subject of continual debate.
In the UK every 5 years, there is a Research Assessment Exercise (RAE) for Higher Education Institutions (HEIs). The most recent RAE exercise (now called REF for Research Excellence Framework) published results at the end of 2014. The RAE/REF process aims to assess all academics (not just scientists) within the context of their field and so give a fairer estimate of quality. In the latest REF, each academic had to submit four “outputs” for assessment. For scientists, these were typically research papers. The “outputs” were assessed by a panel of peers and graded, then the results published as departmental summaries, so departments never know how well outputs from individual academics rated. The RAE/REF is important in the UK since the results directly affect the funding given by central government to individual departments over the next 5-year period
Like any household, UK Universities have to work within a budget. They must spend less than their income in order to break even and keep some surplus for future investment in people, buildings and so on. Income is critical to keeping the lights on and keeping everyone paid. The income is not fixed, but depends on a number of factors such as:
Number of students and where they come from. All students generate fees income, but international students pay more than home students. As a consequence, most institutions actively market themselves across the world in order to raise the proportion of non-EU students.
Research grant income. Academics who win research grants bring income to the university, not only to pay the salaries of the staff on the grants and to buy equipment and consumables, but also in overhead money on the grant. The overhead money is what keeps the lights on and pays for infrastructure costs and essential administration.
Funds from industry/licensing. This can be very lucrative since industry funding normally attracts a bigger overhead. If an institution develops something with high commercial value then this can add significantly to the university income.
Funding directly from government through the REF. After grading departments every 5-years, the size of this funding component is linked to the ranking of the department. The formula for this differs in each 5-year cycle.
So to increase income, institutions can choose to attract more high-paying students, but to do this they have to invest in good teaching staff and student facilities. They can choose to attract researchers who are successful at publishing “high-quality” papers and hence usually also successful at winning grants and thus bringing in overhead income. They can also attract staff who have strong industry connections. Most institutions do a bit of all of this. On the research side, there is a bit of a frenzy of recruitment coming up to a REF year as departments aim to hire research academics who will provide high quality outputs for the REF and so not only be able to fund their own research from external sources, but also boost the likely income from central Govt through the REF formula.
Few institutions have large reserves of cash they can afford to dish out to all their staff to help with their research, but have to think strategically in order to develop new areas with the limited uncommitted funds they have. Should they fund Ph.D. studentships to help newly appointed young Academics get their work going? Should they use the funds to support some core equipment that needs replacing or updating? Perhaps some building work needs doing to allow a new star scientist to install their expensive equipment? Or perhaps a longstanding and successful member of staff has just failed to get their core programme grant renewed and needs some bridging funding while they try again in the next round or with a different funding agency?
It can be difficult for department heads to make decisions about who they support and how. It is clearly complicated and a simple “metrics” based approach is not going to be fair or work effectively for every individual. While there have been some reports in the media about seemingly arbitrary income-based decisions leading to sackings or even suicide, I find it hard to believe that these tough and tragic events are ever due to a single factor. The ability to generate research grant income is clearly an essential part of being a scientist since without funding you can’t do anything. It is also true that few universities can afford to fund research programmes in full from their own resources. What they can do, like the institution I work at, is provide the environment that supports their staff to be as successful as they can in the current, highly competitive world of academic science research.
I was one of the first people in the UK to set up a research group website back in 1993 (you can read a bit about this history on the current group website) so it is a bit odd really that I have not embraced new developments to the web for communication of my ideas and generally to advertise what we do. I guess it is not all that surprising since there are only so many hours in the day and too many media to embrace! As well as general services like WordPress, facebook, twitter, linkedin and so on, there are specialised networks for science such as ResarchGate. I could spend all day (or all weekend) tapping away at each of these and never doing any new science!
As a scientist the most important form of publication is still in peer-reviewed academic journals, so this blog is not going to focus there. See the links from my website for that. Rather, I’ll use this for occasional informational posts/rants about issues in science, and in particular my own field of Computational Biology.
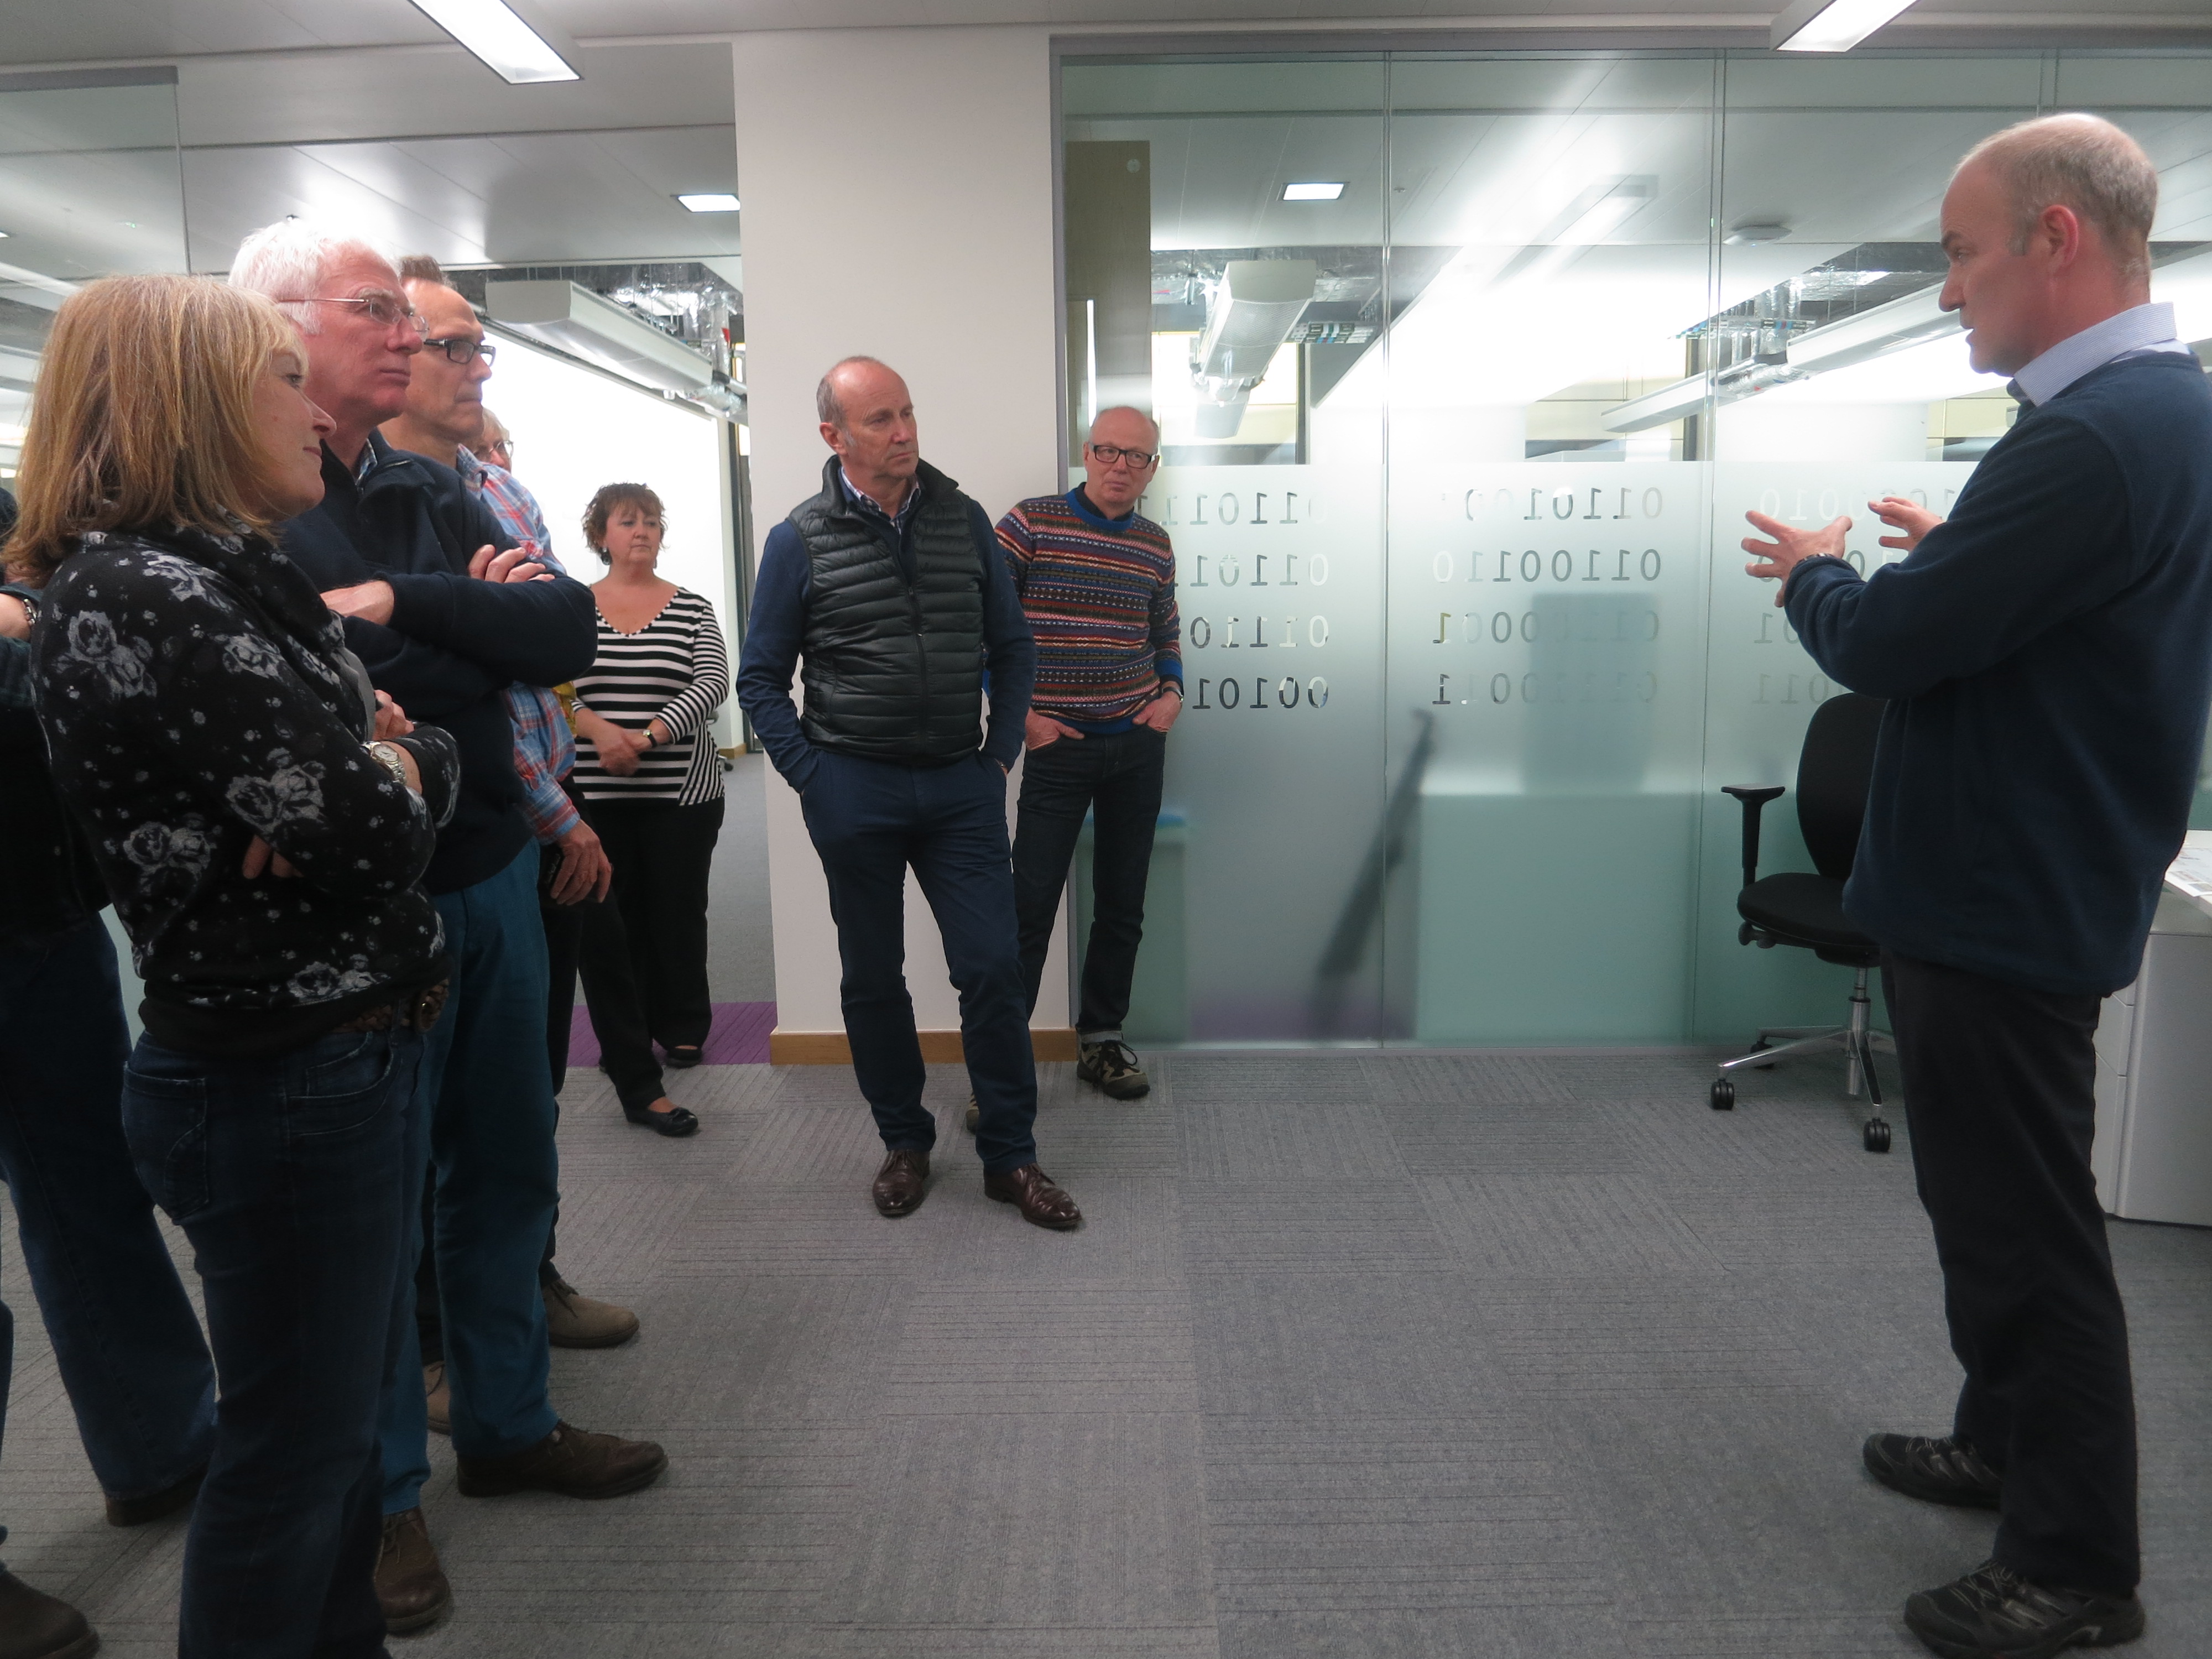
I thought I would post about how scientists get their funding. I’ve written about this before, so have edited a section of another document into this post at the end. I’m writing now because yesterday we had a visit to our shiny new building by Scottish comedian and broadcaster Fred MacAuley so I had a few minutes to explain what Computational Biology was and have a bit of a discussion with him and his group of friends. It might seem odd that we had a visit from a prominent media-person, but Fred is an
Fred MacAulay and friends learning about Computational Biology from Geoff Barton
alumnus of our University and a former Rector of the University. Rectors are usually media-folk (the current one is Brian Cox, the Hollywood actor who generally plays bad guys in the big movies like X-men) and their high profile helps to promote the University in interesting ways. Anyway, the point is that Fred was with a group of friends, all also Alumni of the University who were celebrating 40 years since they graduated. Fred had missed the grand opening back in October of our new building so asked if he could visit for a tour. None of the group had a science background, so it was a perfect audience for my six minute “what we do in Computational Biology and why” talk with an overview of some of the highlights from our Research Division.
I really enjoy talking to non-scientists about what we do. Every time I do it, I am reminded of what a privileged and “small” world we work in. Most people have no real concept of what scientists actually do, what motivates them or even how their work is funded and this always comes out in the kinds of questions I get asked. I think a couple yesterday were:
“How often do you get a Eureka! moment?”
Well, I said: “All the time, it is just that most of them are wrong!”, or as our Research Dean Julian Blow pointed out, “They might be right, but are only small steps that you get excited about!”.
A trickier question was:
“Who tells you what to do research on?”
I hesitated with this one, but then answered that most people go into academic research and become group leaders because they don’t like to be told what to do. Certainly true in my case… The follow up question was then,
“Well, how do you decide what to do?”
This is of course complicated and like most things in life comes down to money… I didn’t say this at the time, so wanted to expand a bit here.
Ideas are free. As an academic scientist you probably have lots of ideas. Well, I hope so. If not, you are perhaps in the wrong job!
Proving ideas are right is not free. Even if you are a theoretician who works alone only with pencil and paper, turning your idea into a solid proof takes your time. Someone has to pay for this since you have to have food to eat and somewhere to live. If you do experimental science, then it certainly costs to set about exploring your idea since you have to build a team and pay for equipment, consumables and travel.
All research requires people to do it, as well as equipment and consumables, not to mention space and electricity. People need to eat and have somewhere to live, so like to get paid for their work. As a consequence, all research takes money! So, where does funding for scientific research come from in the UK and how do you go about getting it? As an independent scientist (a PI – Principal Investigator), a lot of your time is spent finding ways to fund your research and maintaining continuity of staff in your research group. There is very little funding in the UK for long-term (i.e. to retirement age) appointments, just about everything is funded on short-term grants from one or more organisations. This presents an interesting and challenging problem for a PI, not to mention his/her staff.
There are three main sources of funding: Government “Research Councils”, Charities and Industry. I will focus on Research Council and Charity funding since this is the most common source and the methods of applying are similar and follow an established pattern. Funding organisations offer different types of grants to support research. They include project grants that might fund a single post-doctoral researcher for three years, some equipment money, laboratory consumables and travel (so they can go to conferences, learn what else is going on in their field and tell people about what they have done) to work on a specific problem. Project grants can be bigger or longer, but 3-years and one post-doc is the norm, at least in biology-related subjects. Longer term funding is also possible and is often referred to as a programme grant. A programme grant may fund several post-doc researchers for 5 years. This allows the PI who holds a programme grant to try more ambitious research and to develop multiple themes in their research portfolio. Most successful PIs will hold multiple grants at any one time and from multiple organisations and will spend a fair proportion of their time juggling funds to enable people coming go the end of contract to keep working until the next grant starts.
So, how do you get a grant? First, you have to have a good idea! Then, you identify the funding agency that is most appropriate to approach. There may be specific calls for proposals in your area, or you may apply in responsive mode. Funding is not infinite, not all good ideas can be supported, so funding agencies appoint committees that specialise in different areas of science to assess grants and decide which will get funded. You have to target one of these committees with your application. You then need to write the grant application. This will include a detailed costing for personnel, etc, as well as a detailed scientific case. The scientific case will include relevant background leading up to the proposed research as well as a description of what you are proposing to do. Space is usually limited to 5 pages for a three-year, single post-doc grant, so you have to be concise and clear in what you write. The application will also include sections to describe your scientific track record and previous relevant publications. Once everything is together, you submit the application to the funding agency in time for whatever deadline they work to. There is a lot of skill involved in writing grants – it is different to writing papers for publication. You have to present your past work and planned research in a way that is clear and appealing to someone who may not be an expert in your narrow field. This is a particularly big challenge.
What happens then? First, the office checks that you have included everything you should on the proposal and that your proposal is in the right area for their agency. Then, they send the proposal to up to 10 people for peer review. Other scientists in your field (often your competitors) read your grant, write comments about the grant application and give it a grading. At the next committee meeting of the committee that your grant application will be assessed, your grant will be one of many, possibly 150 that are considered in 1-2 days by the committee. The committee consists of perhaps 20 people like you who are experts in some relevant area of science, plus the administrative staff of the funding agency and will be chaired by a scientist like you. Each committee member is given a set of grants to speak to and each grant will have two committee members who will speak to it. The committee members will have been sent all the grant applications and the peer-review reports in advance of the meeting and will have carefully read at least the applications that they are speaking to. Bear in mind that each member of the committee will have had to read around 10 grants in detail, so if your grant is not written clearly, they may miss the point of it. Committee members may also read other grants in the set if they have a particular interest in them and time to do it!
All committees work in different ways, but one common procedure is as follows: At the committee meeting, the grants are initially ranked by the scores given by peer-reviewers. The committee quickly reviews low-scoring grants to check that the scores are fair, these grants are then eliminated. Any very high-scoring grants may also be put to one side as almost certain to be recommended for funding. The committee then spends most of its time discussing the rest of the proposals, which normally amounts to 80 or 90% of the proposals submitted!! Discussion goes grant-by-grant. For each grant, the two people who have to speak to the grant take it in turn to summarise the grant and what they think of it given their understanding of the proposal and the comments of the referees. The wider committee then have the opportunity to comment/ask questions and generally discuss the merits of the proposal. At the end of discussion, a score will be assigned to the grant and it will be added to a preliminary ranking of all the grants. This is often done by one of the staff on a spreadsheet that is visible on a large screen. Once all the grants have been discussed and assigned scores, the ranking is re-examined by the committee to see if, now that all grants have been considered, that the ranking given to each grant is fair. Some re-organisation of scores can happen at this stage leading to a final ranking that is put forward. The precise cut-off for funding will vary from committee to committee and from meeting to meeting depending on the amount of money the agency has available to fund grants at that time. However, many good, high-ranked grants do not get funded, simply due to lack of funds. Most scientists get used to some of their very good grants being highly ranked, but not funded.
Is the system fair? At the committee, anyone who has a conflict of interest with the proposal being discussed has to leave the room while it is discussed. A conflict might be that their own application is being discussed, or that of a colleague at their own institution. The main problem is that most grants are potentially fundable, so the committee has a difficult job ranking them. A key component on the committee is who speaks to your grant. Their opinion can make a grant go up in rank or down.
So, getting funding for your research is tough and competitive, but you can’t do research without funding. Success in obtaining funding is thus one of the metrics by which individual scientists are judged. Unfortunately, with some committees on some days, it can seem a bit of a lottery which grant applications get funded and which don’t but it is hard to see a fairer way of choosing, without injecting more money into the system.